
Data and Dashboard Services in Dubai
ENH Marketing builds live reporting dashboards and marketing attribution systems for UAE businesses. We connect the platforms you already use, define how each metric is calculated, and create one view that updates automatically. Every dashboard project includes ongoing monitoring and technical support after launch.































What We Build
We build dashboards that bring marketing, sales, website, ecommerce, finance and operational data into one place.
Each dashboard is planned around the people who will use it and the decisions they need to make. The information, filters, user access and reporting frequency are agreed before development begins.
We can replace an existing manual report, improve a dashboard that is no longer trusted, or build a new reporting system from the beginning.
- 01
Marketing Performance Dashboards
A marketing dashboard brings campaign data from different advertising and analytics platforms into one view. It can show spend, leads, sales, conversion rates, acquisition costs and return on ad spend by platform, campaign, location, product or reporting period.
- 02
Sales and Lead Dashboards
Sales and lead dashboards connect marketing enquiries with CRM and sales data. They can show lead sources, qualification rates, response times, pipeline stages, meetings, sales and lost opportunities.
- 03
Ecommerce and Revenue Dashboards
Ecommerce dashboards combine advertising, website, order and revenue data. They can report purchases, product performance, average order value, customer acquisition cost, refunds and revenue by channel.
- 04
Marketing Attribution Reporting
Attribution reporting connects marketing activity with the enquiries, sales or revenue recorded by the business. The reporting method, attribution window and available data are agreed before the dashboard is built.
- 05
Management Dashboards
Management dashboards provide a focused view of the metrics required by senior teams. Different views can be created for management, marketing, sales, finance and other departments. Access can be limited according to each user’s role.
- 06
Data Integration and Preparation
We connect the required sources and prepare the information before it reaches the dashboard. This may include matching fields, removing duplicates, correcting formats, and creating consistent categories across different systems.
Marketing ROI reporting requires the marketing cost and the resulting business value to be measured over the same period.
The dashboard can combine advertising spend, agency fees, production costs, sales, revenue or gross profit where the required information is available.
The correct calculation will depend on the business model. An ecommerce company may report revenue and gross margin, while a B2B company may need to report qualified pipeline, closed sales and customer value. The agreed calculation is documented before it is added to the dashboard.
The dashboard scope depends on the data sources, users and reporting requirements.
A small marketing dashboard may connect advertising platforms, Google Analytics and a CRM. A larger reporting system may include ecommerce, finance, sales, call tracking and several user views.
A small marketing dashboard
- advertising platforms
- Google Analytics
- a CRM
A larger reporting system
- ecommerce
- finance
- sales
- call tracking
- several user views
The data diagnostic identifies:
01
Which systems need to be connected
02
Which metrics need to be reported
03
How each metric should be calculated
04
How often the data needs to update
05
Which filters and views are required
06
Who should have access
07
Whether past data needs to be imported
08
Whether a data warehouse is required
The proposal separates data preparation, integrations, dashboard development, and managed support.
Tell us which reports your team currently prepares, which systems hold the information, and where the numbers do not match.
The proof — 22 client stories
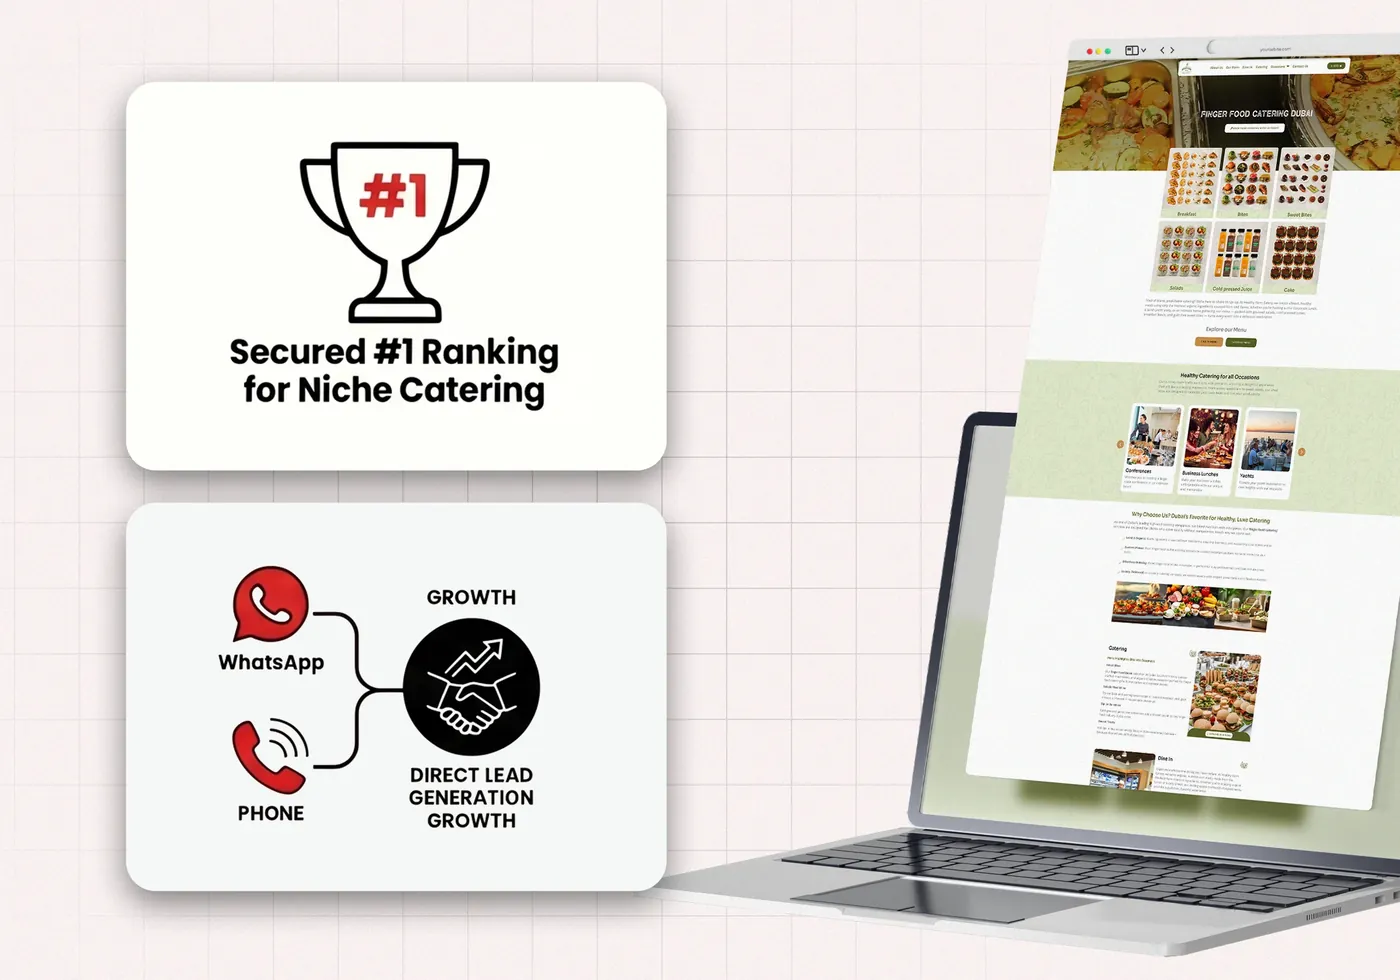 01
01Healthy Farm Eatery
Consistent Sales Growth Driven by High-Quality Lead Generation
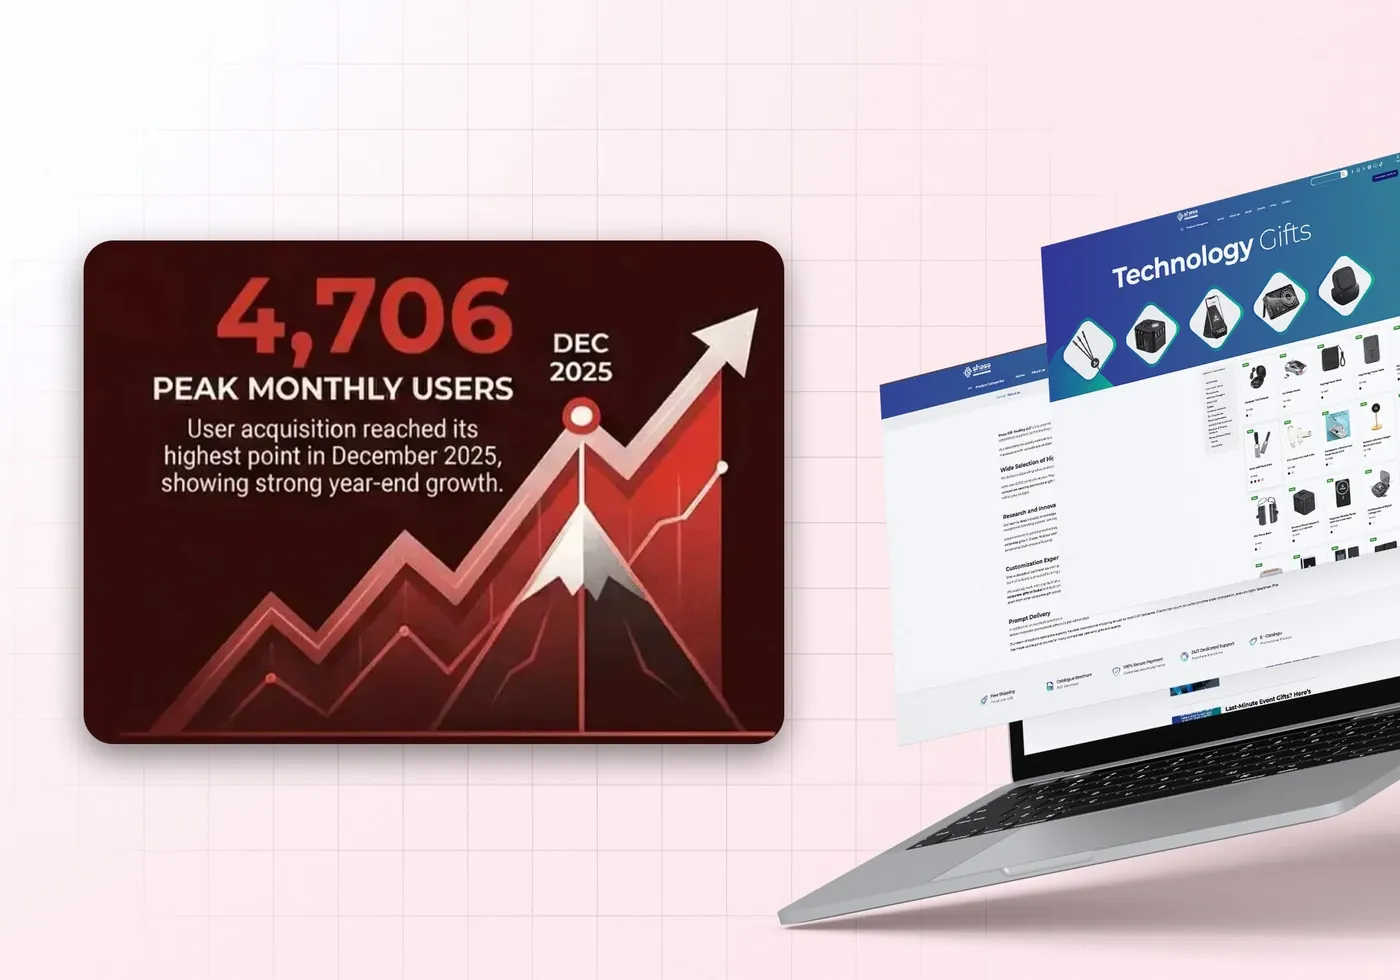 02
02Shass Gift & Promotions
Driving Search & Local Market Dominance for a Corporate Gifting Brand
 03
03ACC Gulf
Strengthening Search Authority & Local Lead Growth in Industrial Supply
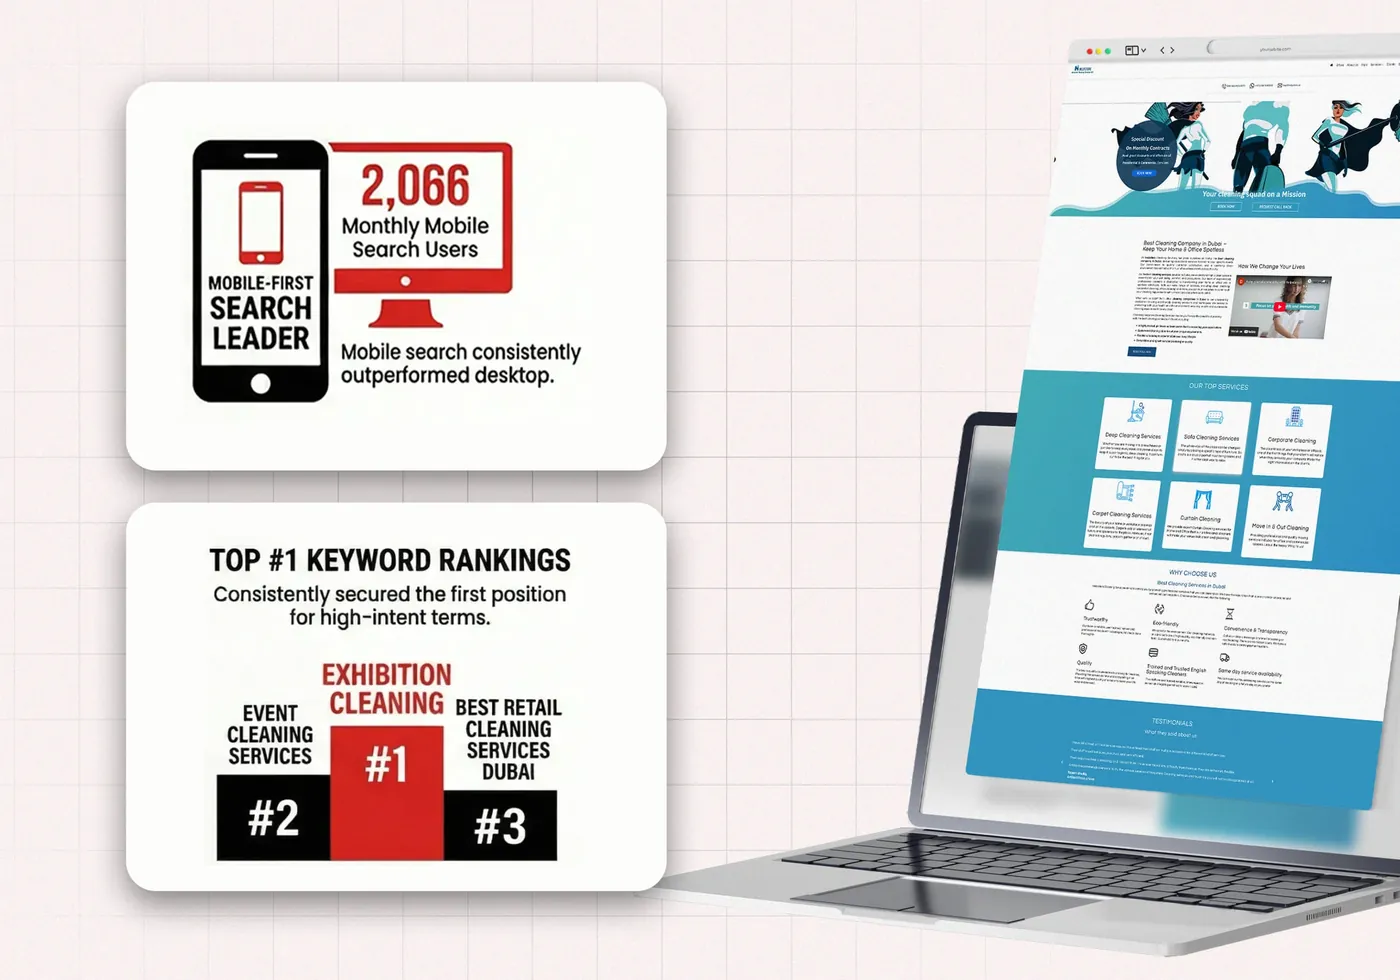 04
04Helpsters Cleaning Services
Capturing High-Value Cleaning Contracts Through Targeted SEO
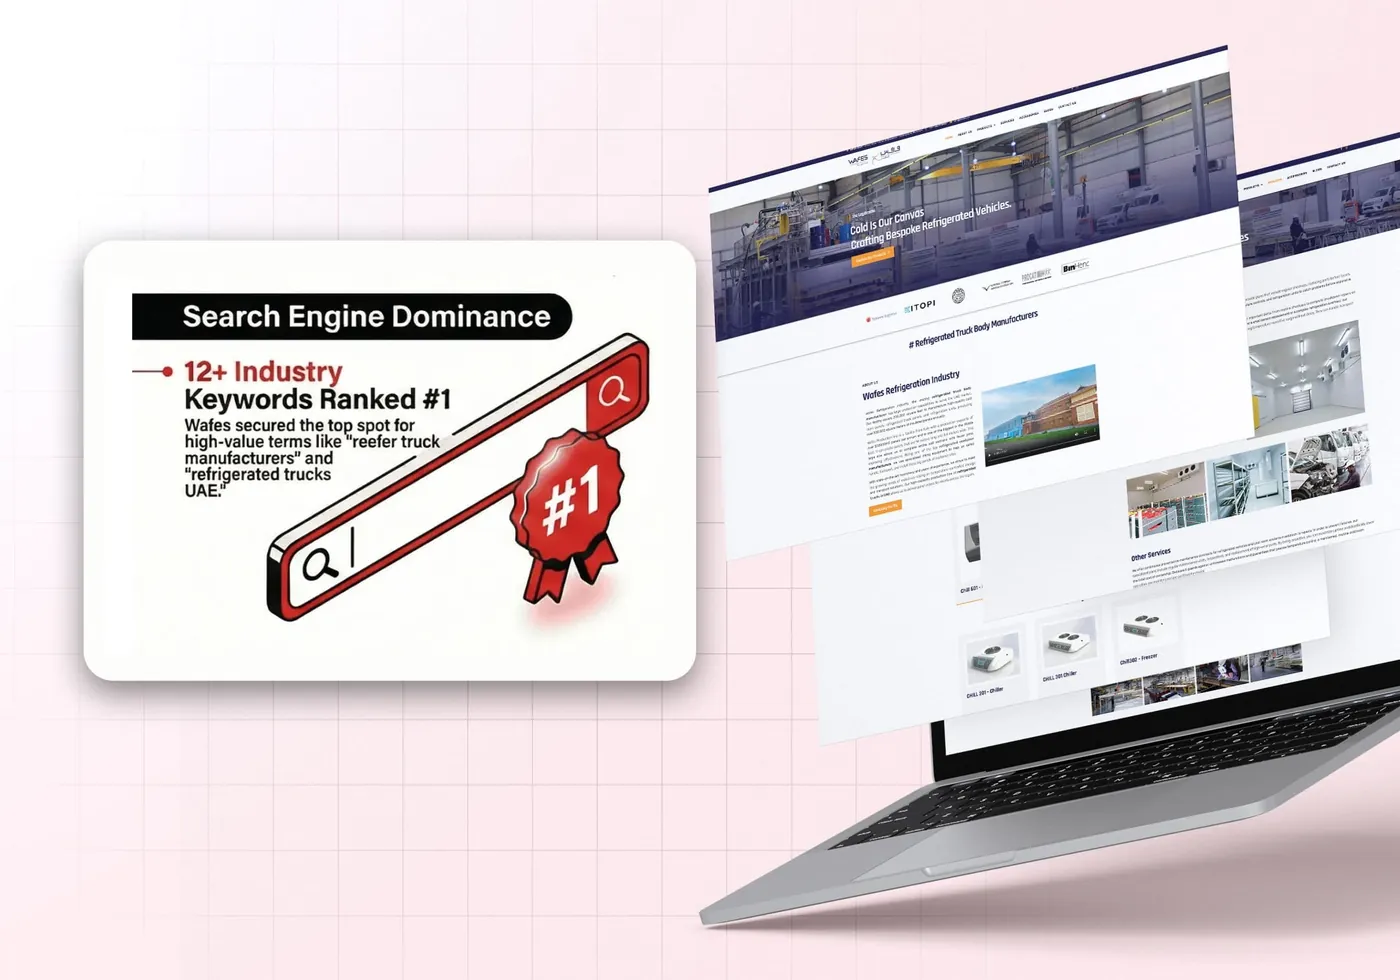 05
05Wafes Refrigeration Industry
Transforming Digital Visibility for a Refrigeration Manufacturer
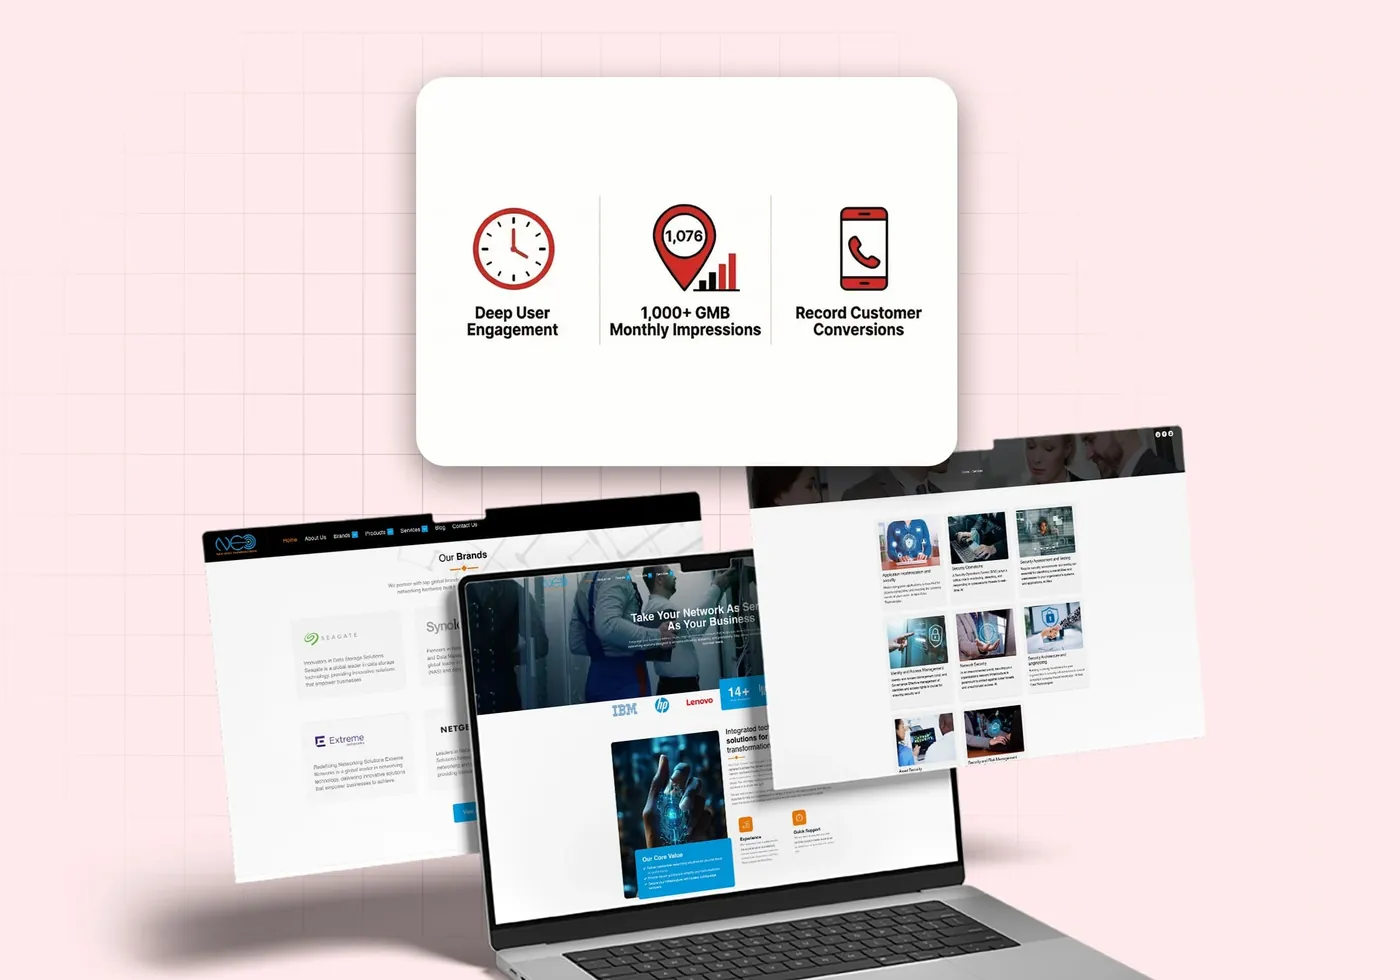 06
06Neo Data Technologies
Expanding Search Visibility & Lead Growth for an Enterprise IT Distributor
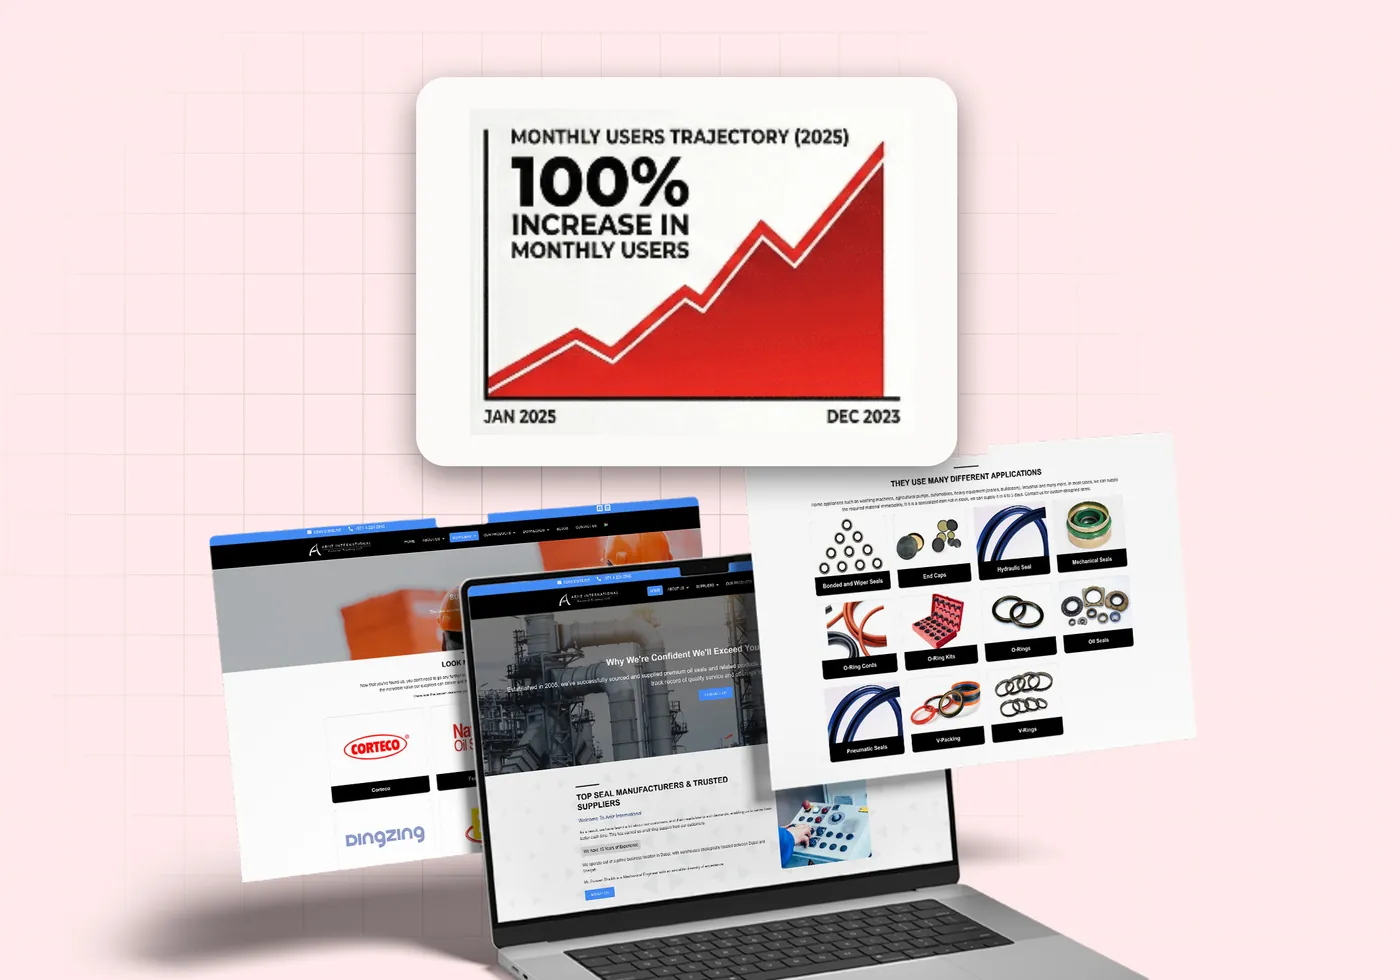 07
07Ariiz International
Driving High-Intent Search Growth for an Industrial Sealing Supplier
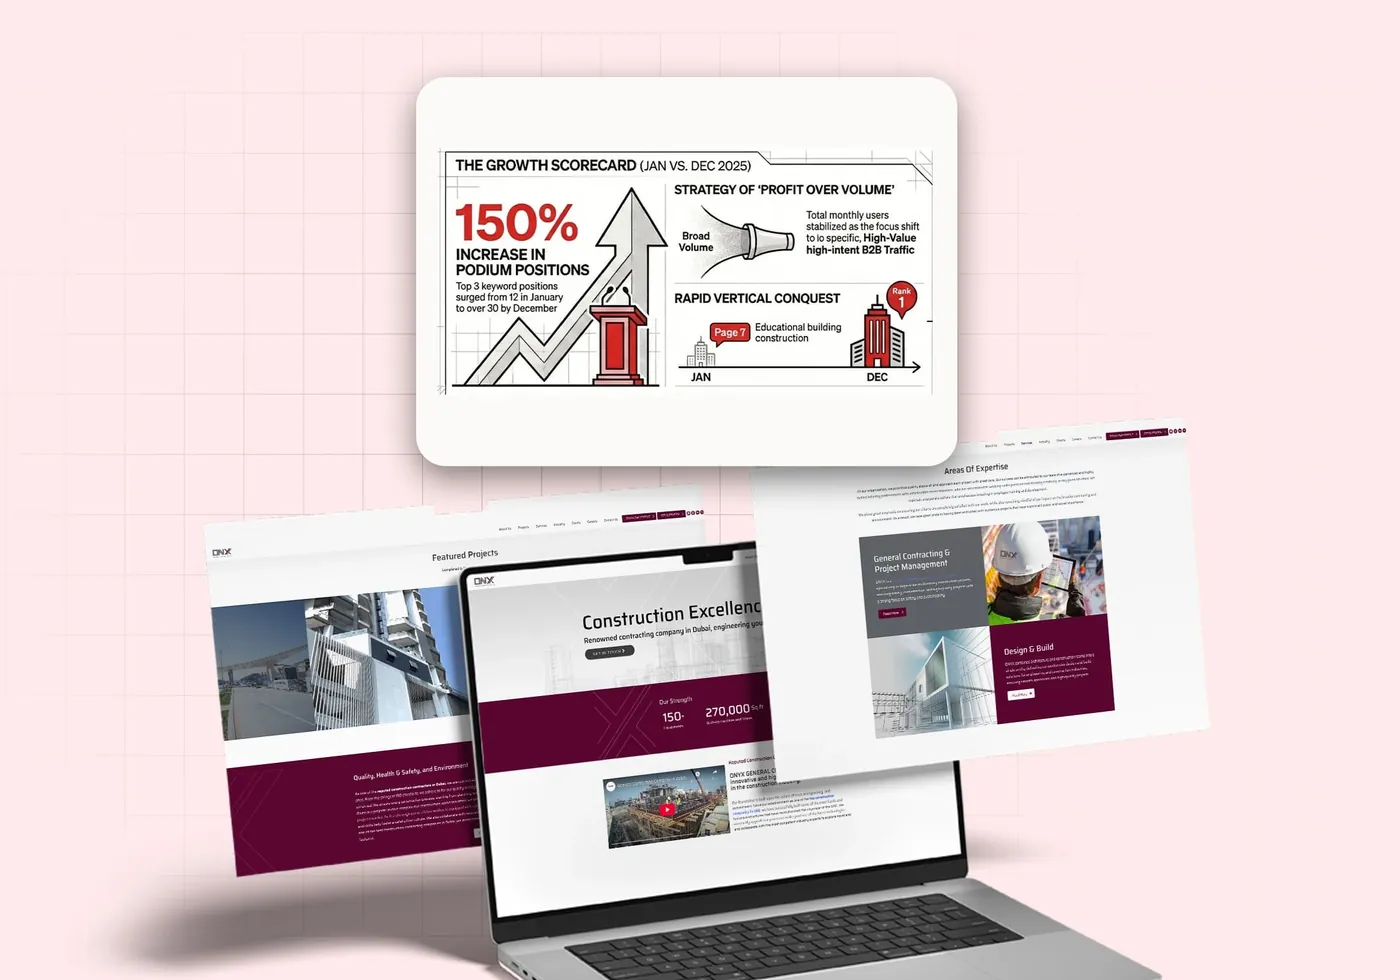 08
08Onyx General Contracting
Achieving Digital Dominance with 1,350+ Monthly Users and 6,100+ GMB Impressions
 09
09DGR Aviation Training Services
Driving High-Intent Visibility for Aviation Compliance Training
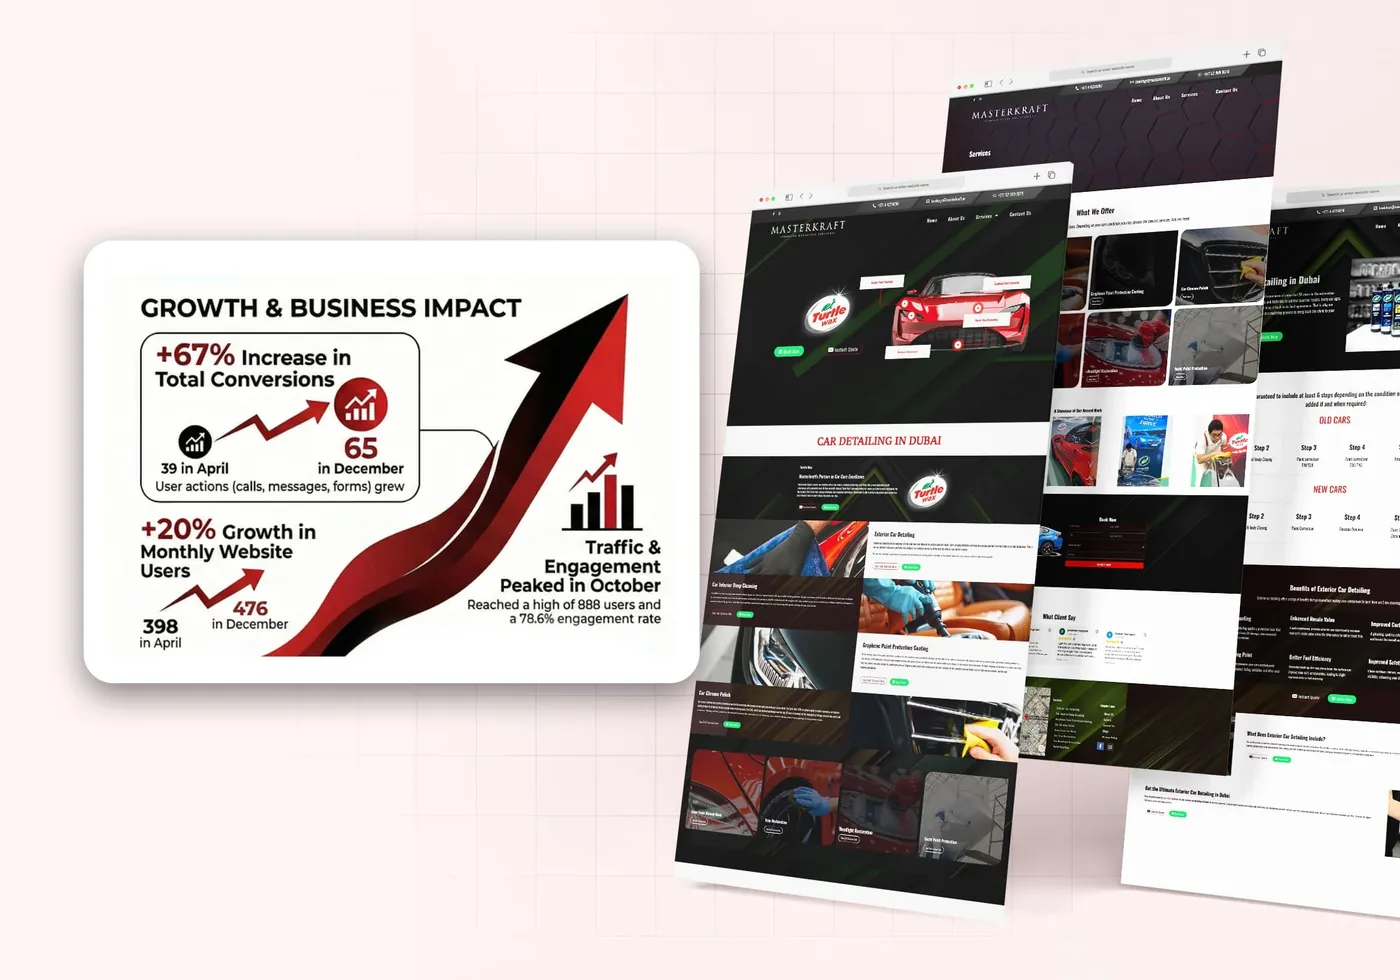 10
10Masterkraft
Driving Digital Growth with a 346% Increase in Website Traffic
 11
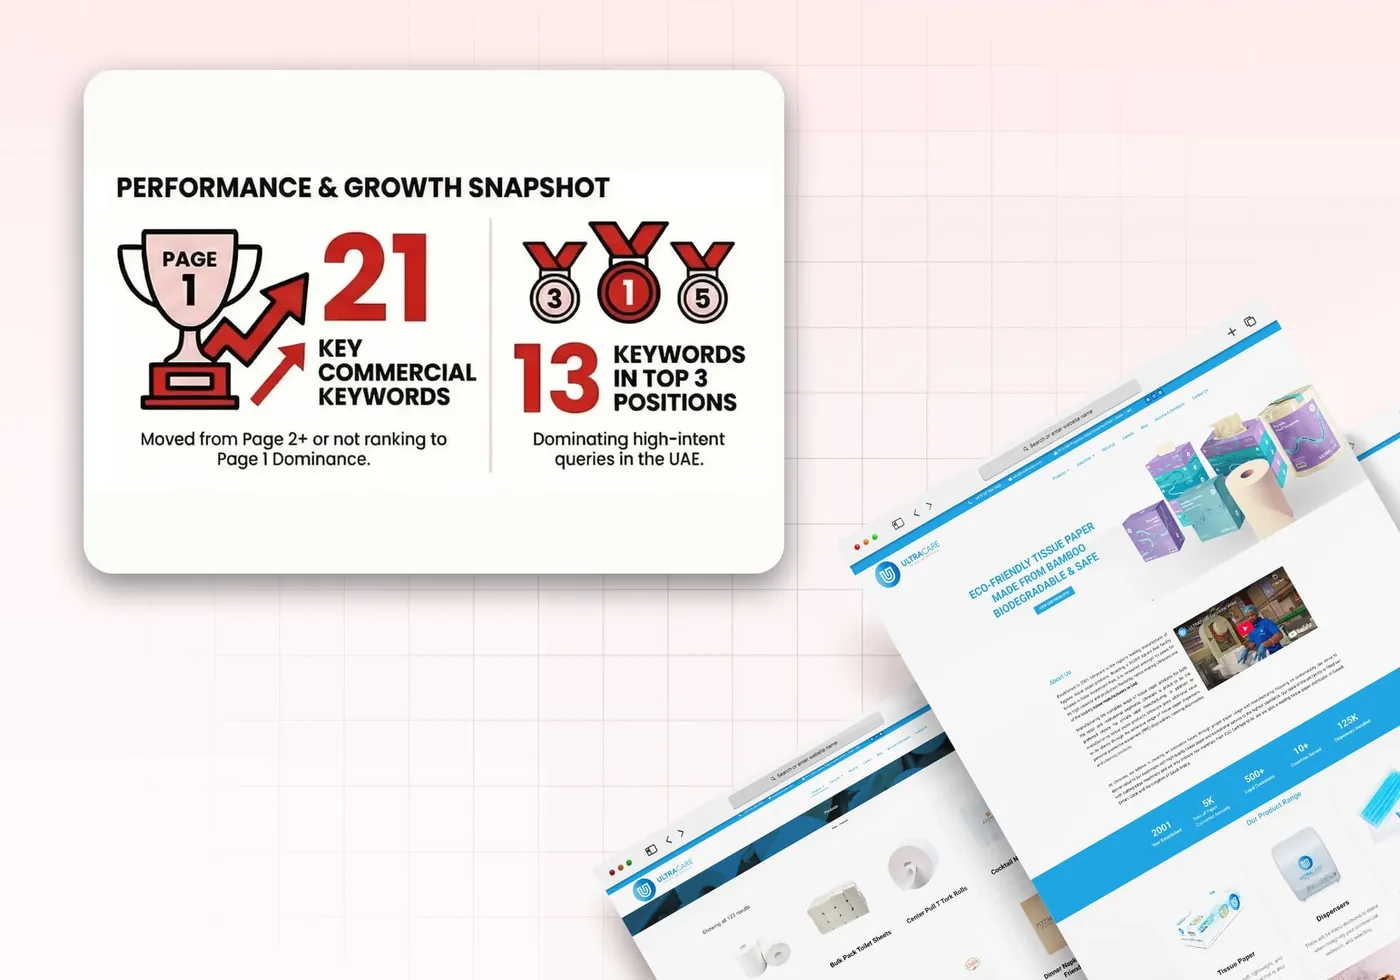
11Ultracare
Elevating Engagement - A 371% Boost in Website Interactions
 12
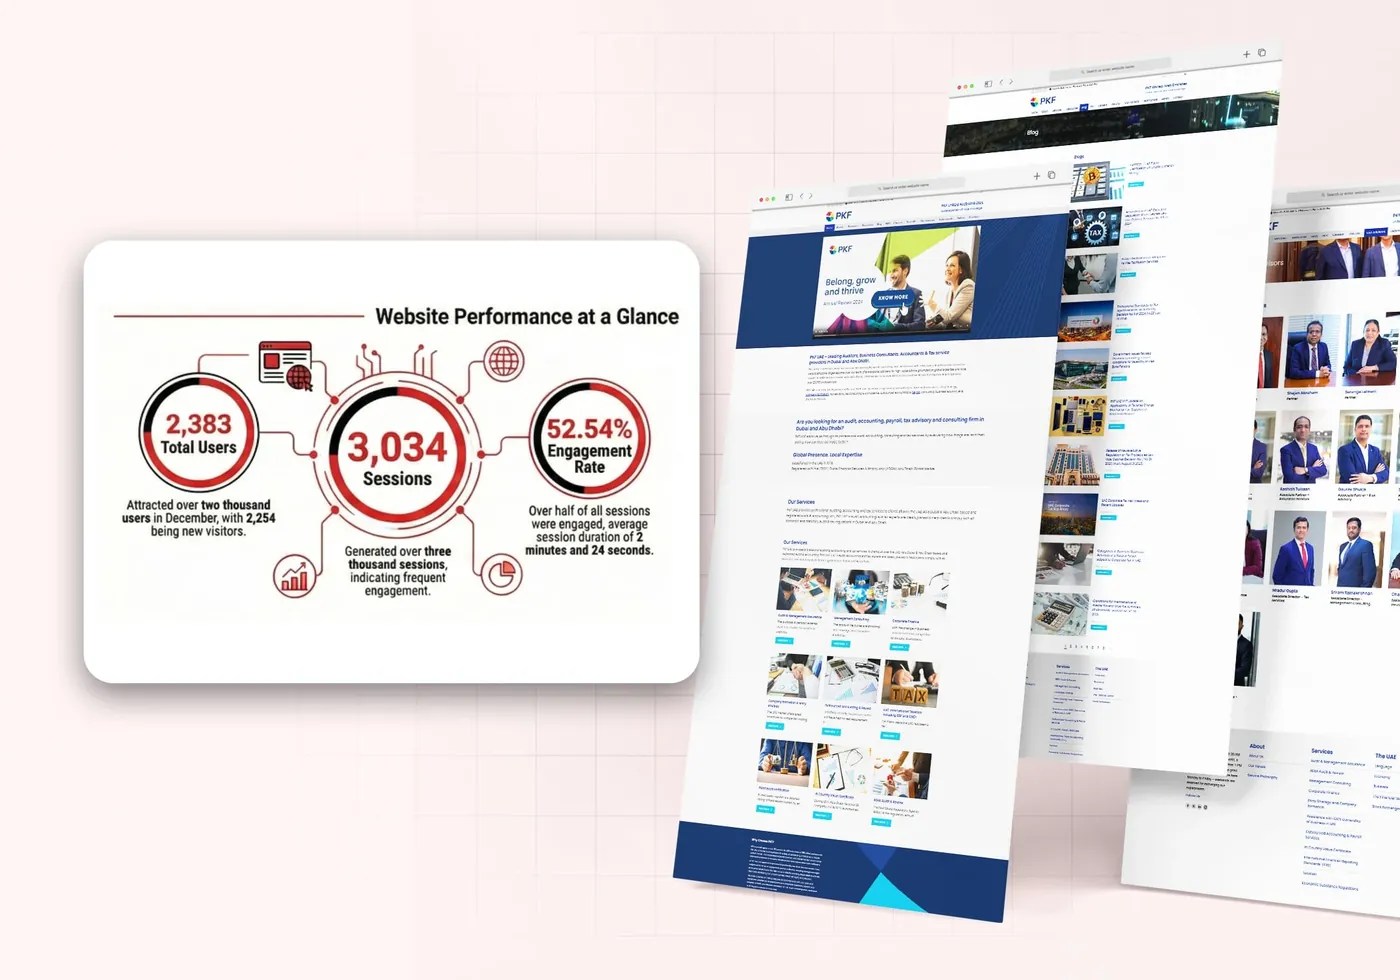
12PKF UAE
Driving Success for PKF with 71% Traffic Surge
 13
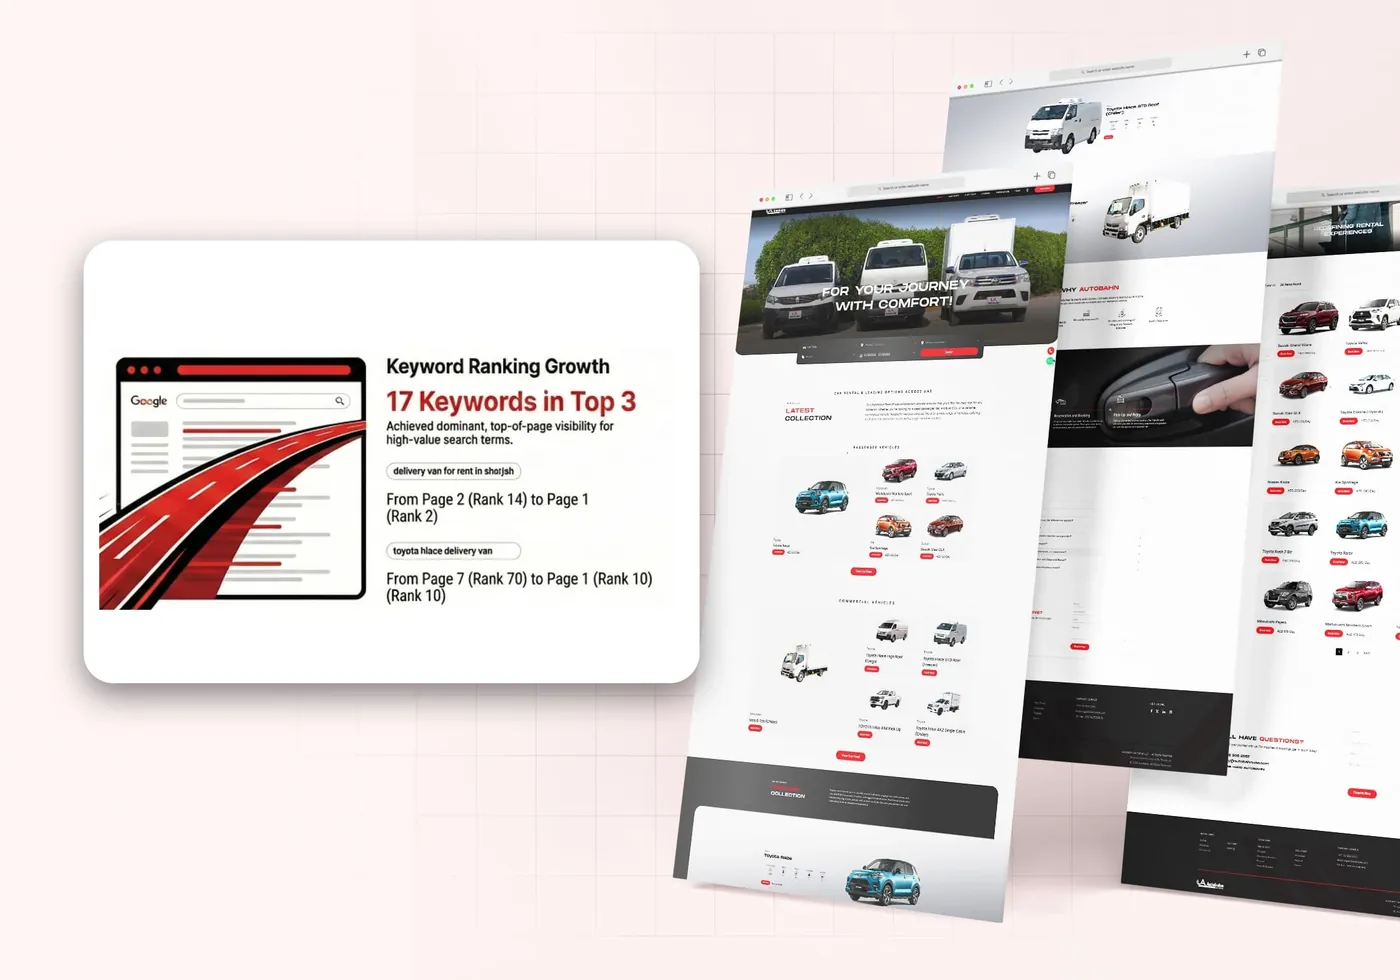
13Autobahn Car Rental
Accelerating Success with a 155% Growth in Website Traffic
 14
14AllDay Supermarket
Incredible 64x Increase in Social Media Impressions for AllDay Supermarket
 15
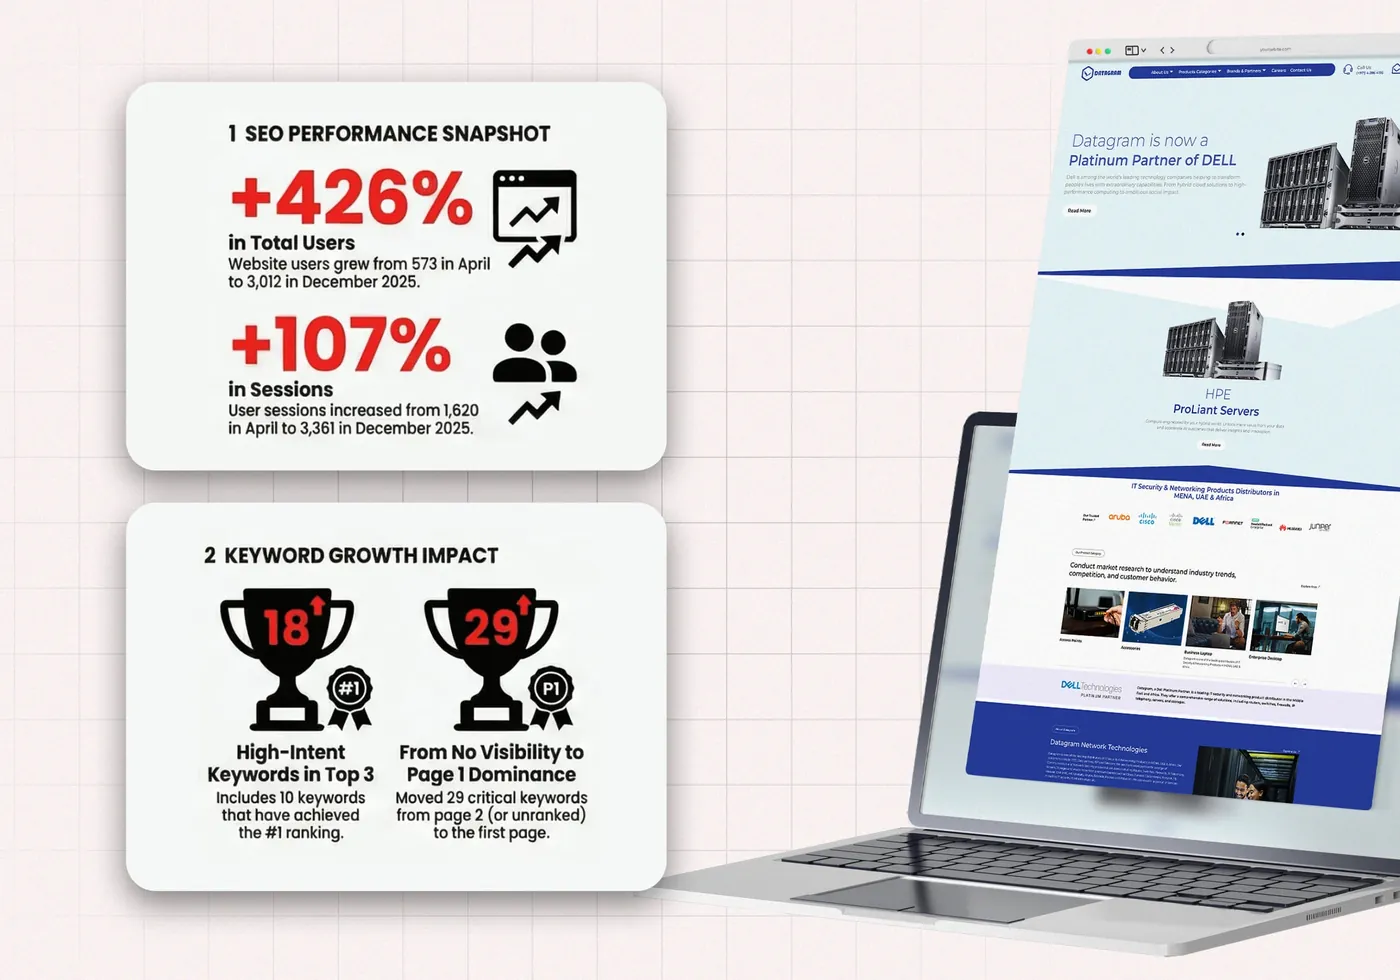
15Datagram Store
Transforming the High-End IT Product E-Commerce Experience
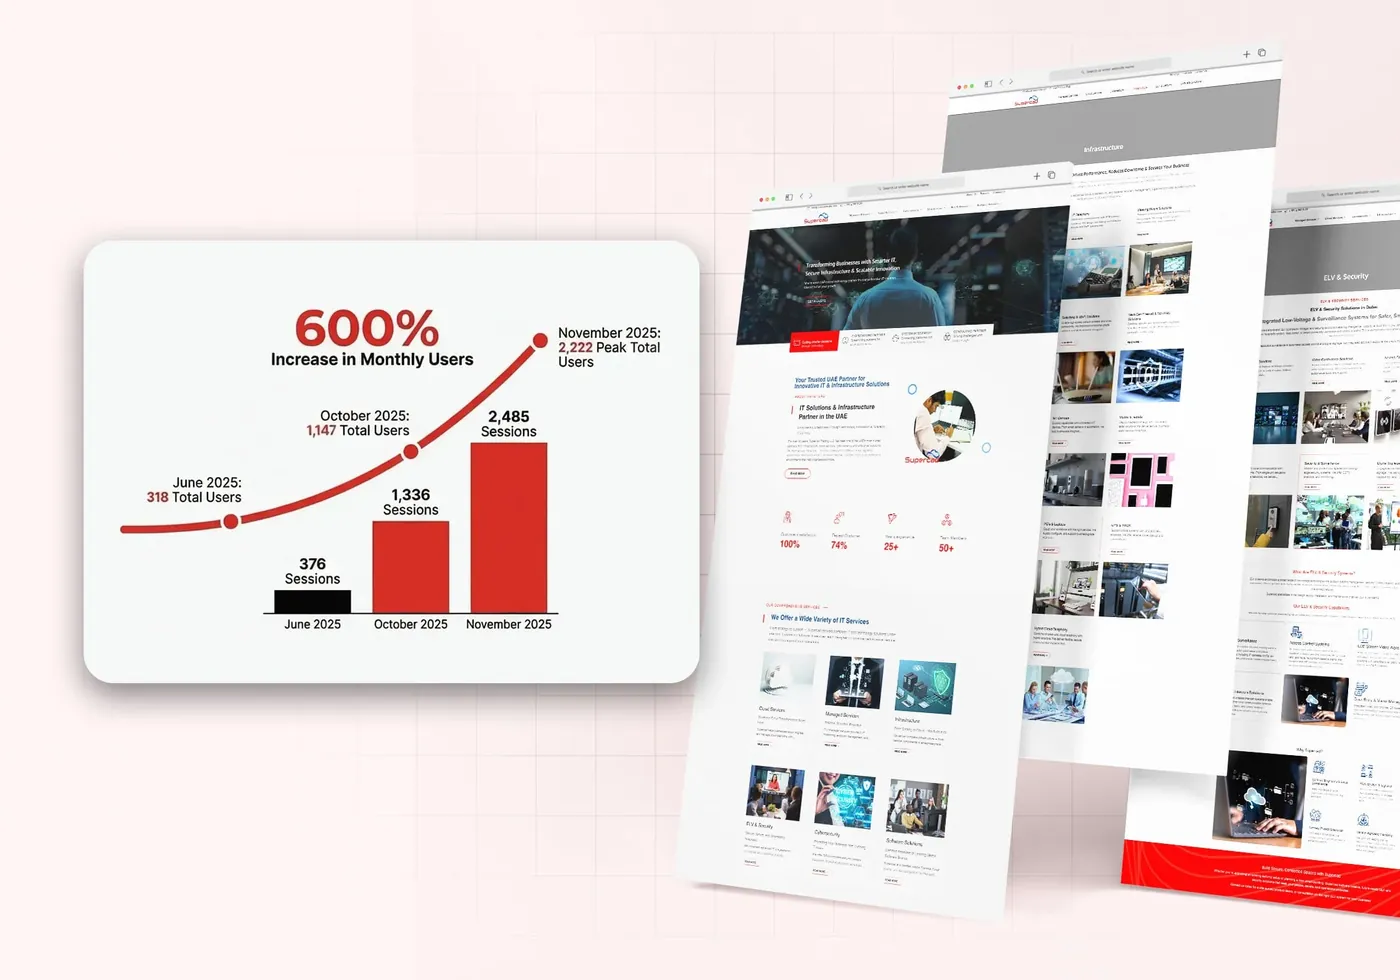 16
16Supercad Trading
Revamping IT Solutions with a 128% Increase in Organic Traffic
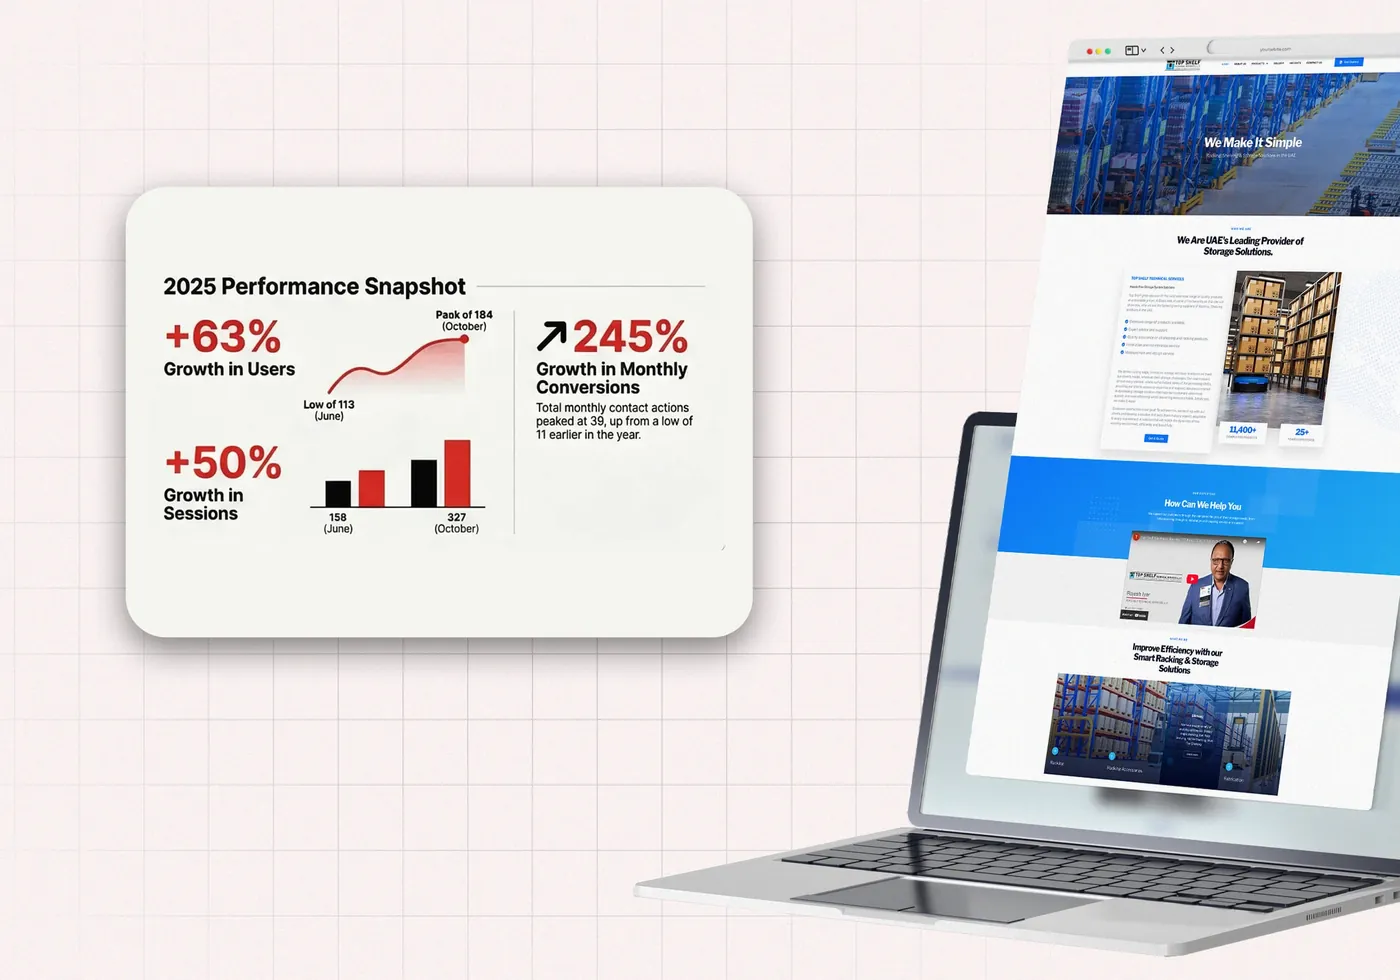 17
17Top Shelf Technical Services
Boosting Organic Traffic by 245% in 12 months
 18
18Arbrit Safety
Empowering Health and Safety with a 242% Increase in Enquiries
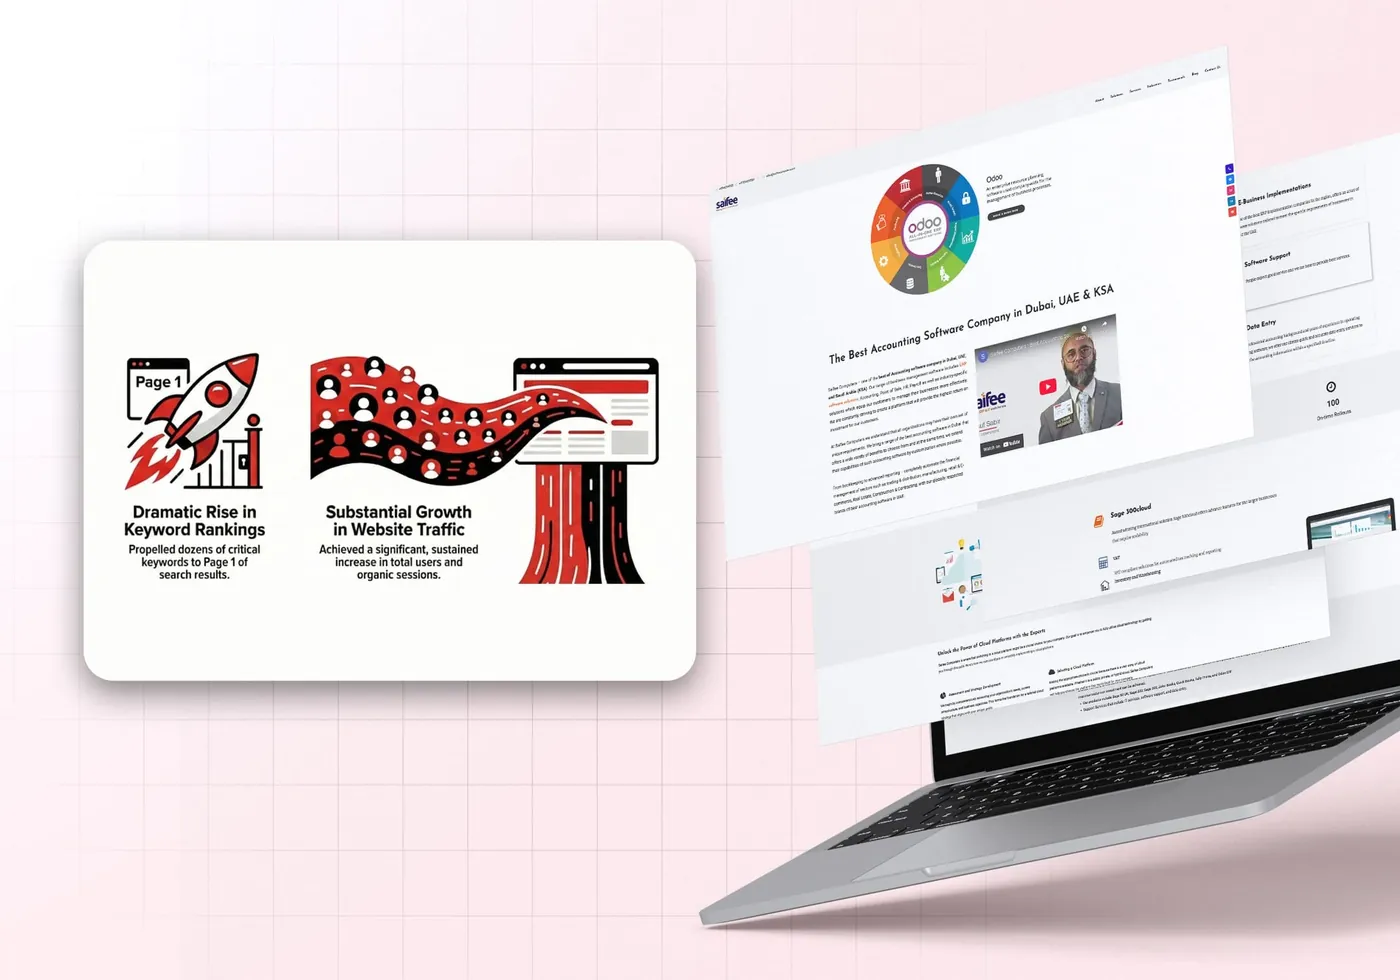 19
19Saifee Computers
Accounting Software Sales with an 85% Increase in Enquiries
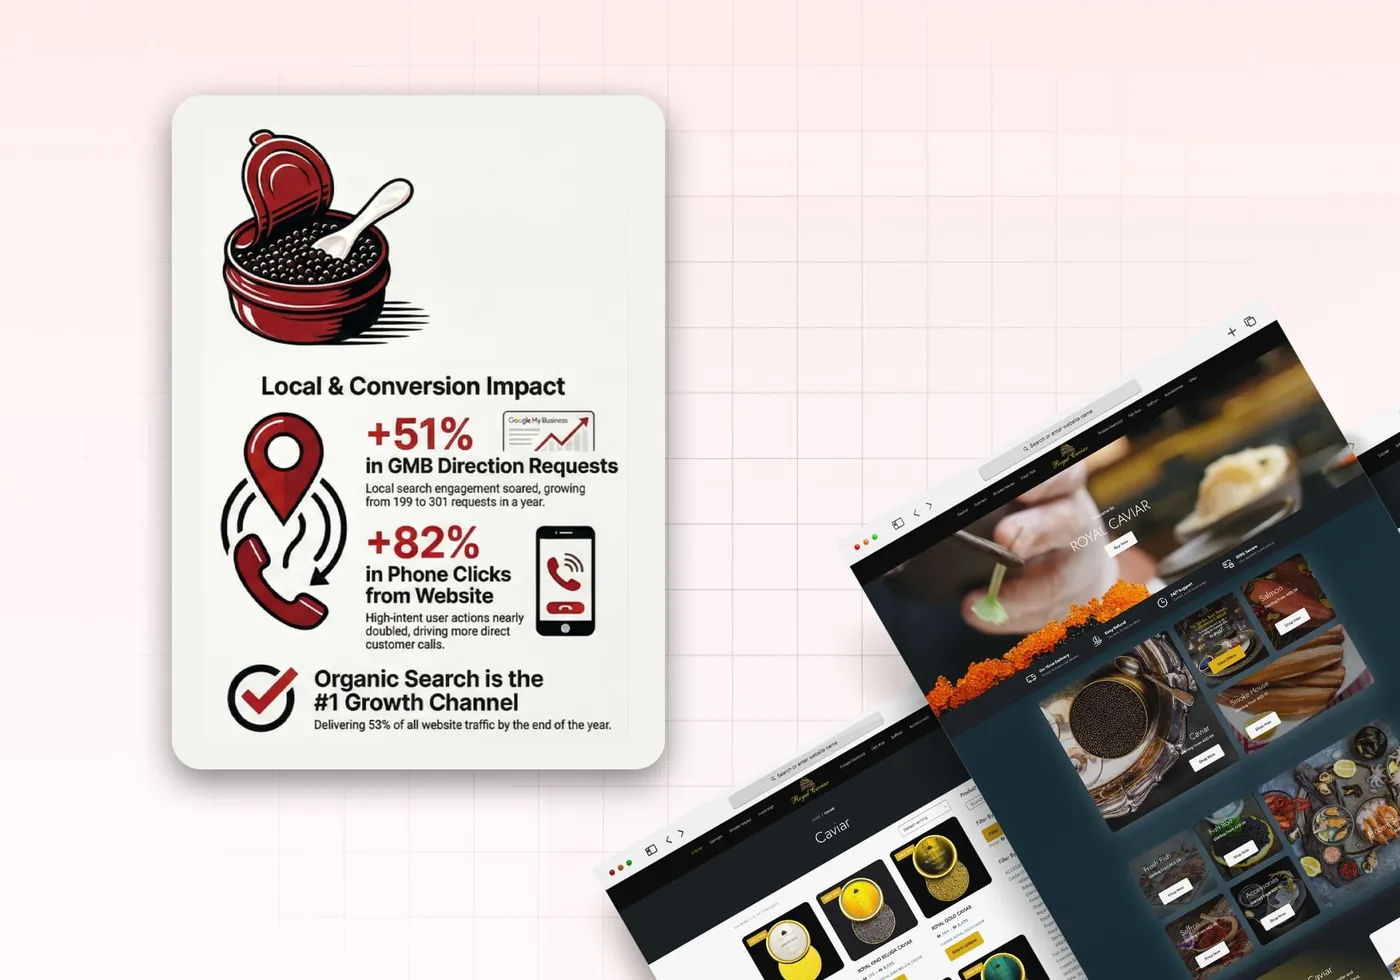 20
20Royal Caviar
Increase in sales by 132% in the First Six Months
 21
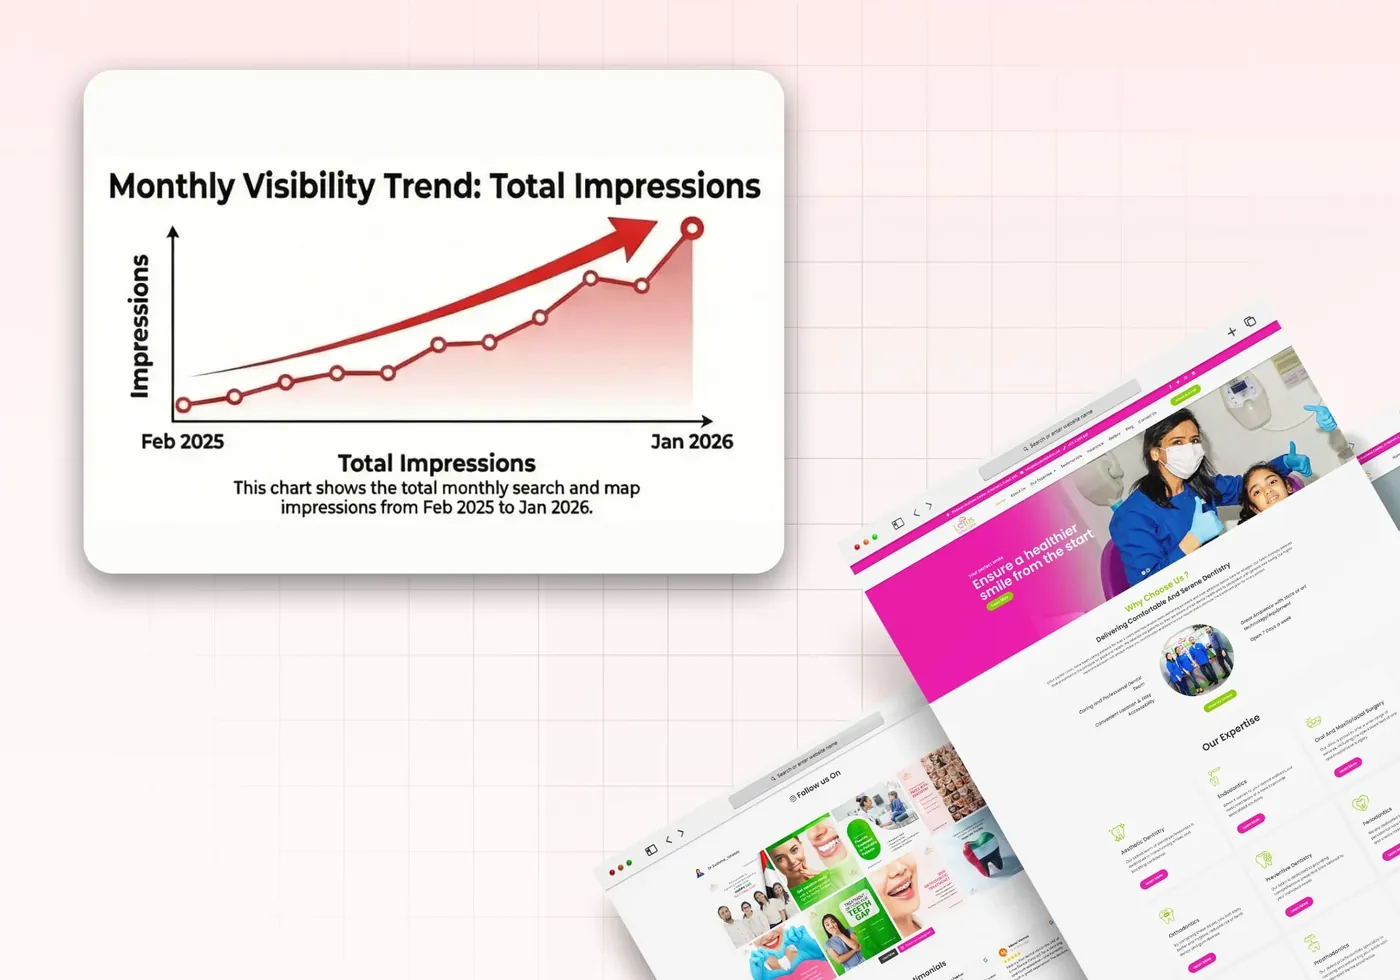
21Lotus Dental Clinic
29% Increase in Local Calls for a Dental Clinic
 22
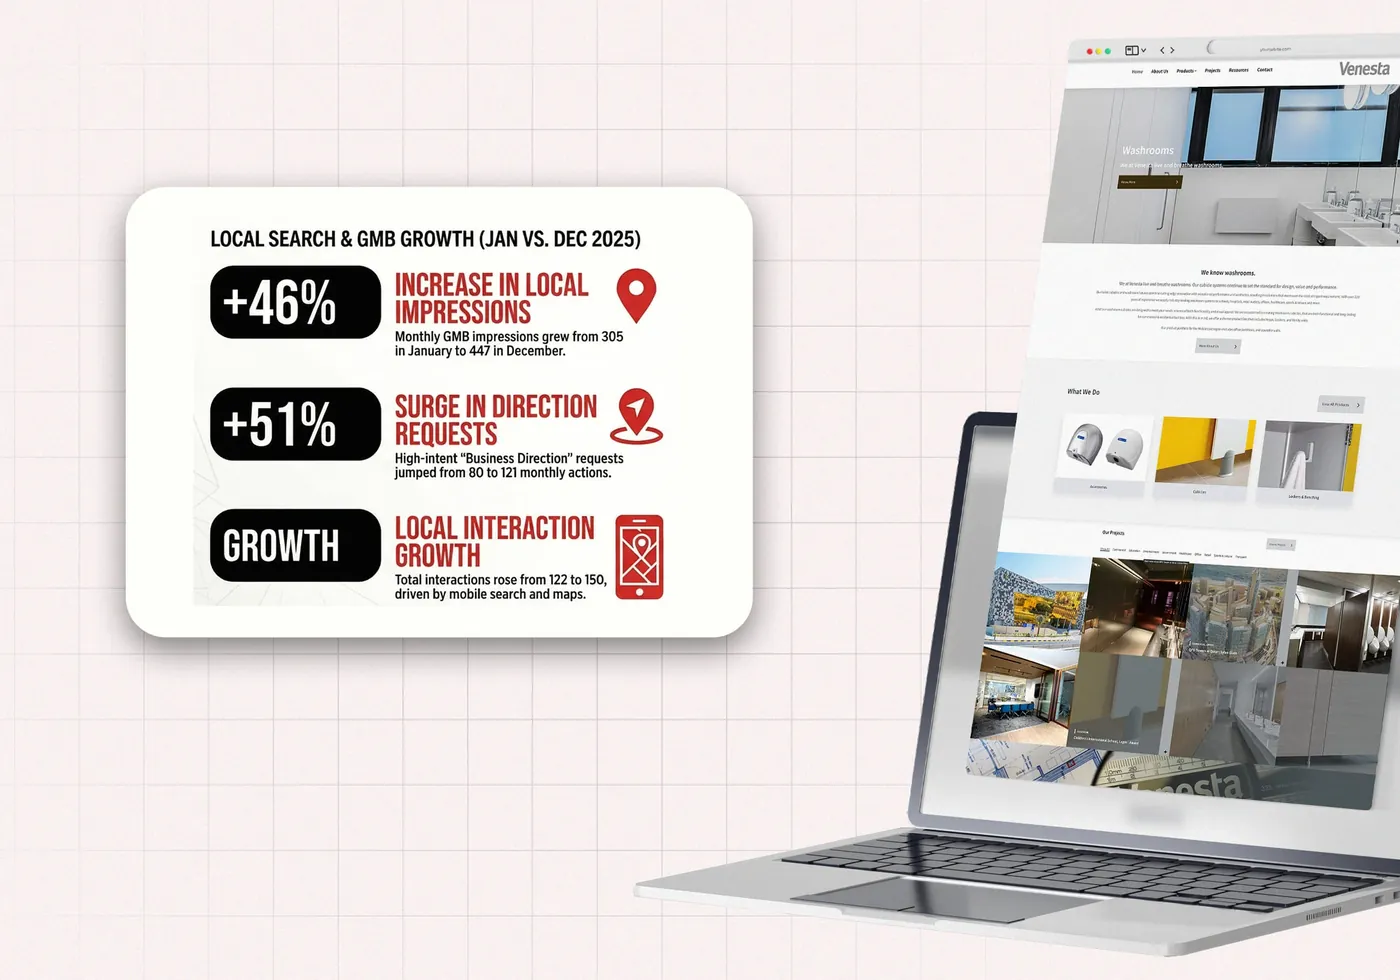
22Venesta
New Market Expansion for a Washroom Solutions Provider
next?Start the climb
FAQ
Everything you need to know about working with Dubai’s result-driven digital marketing agency.
A marketing dashboard brings performance data from different platforms into one reporting view. It can show advertising spend, leads, sales, conversion rates, acquisition costs, revenue, and return on ad spend.
The dashboard should include the metrics required to make a clear decision. The exact content depends on the business. Most marketing dashboards include spend, leads or sales, acquisition costs, conversion rates, and results by platform or campaign.
We can connect advertising, analytics, CRM, ecommerce, finance, call-tracking, spreadsheet and database sources when the platform allows access. The data diagnostic confirms which systems can be connected and how frequently they can update.
Platforms may use different attribution windows, conversion definitions, time zones and methods for identifying users. Advertising platforms may also report conversions that are missing from the CRM or claim the same conversion across several channels. We document these differences and agree which source should be used for each metric.
We can improve attribution by connecting more reliable sources, agreeing on consistent definitions, and recording offline outcomes in the reporting. Some uncertainty may remain because of privacy restrictions, cross-device journeys and missing customer information. These limits will be explained in the dashboard.
We compare the agreed marketing costs with the sales, revenue, gross profit or pipeline linked to that activity. The calculation depends on the available data and the business model. The method is agreed and documented before it is added to the dashboard.
A data warehouse is not required for every dashboard. Direct connections may be enough when there are only a few sources and limited reporting requirements. A warehouse may be recommended when the business has several systems, large data volumes, historical reporting, or complex calculations.
The platform is selected according to your data sources, reporting requirements, user access and existing software. This may include Power BI, Looker Studio or another suitable reporting tool. The recommended platform is confirmed during the diagnostic.
The timeline depends on the number of sources, the condition of the data, and the complexity of the reporting. A dashboard with a few clean sources will take less time than one requiring historical imports, data correction, and several user views. The confirmed timeline is included in the proposal.
There is no standard price because each reporting setup is different. The cost is based on the data sources, preparation work, dashboard views, attribution requirements, and ongoing support. These items are shown separately in the proposal.
ENH Marketing monitors the data connections, refresh schedules, and technical performance through the monthly managed service. Your team remains responsible for entering accurate information into the source systems.
Your business retains ownership of its source data. Our standard position is that the custom dashboard, data model and documentation belong to you after the project is completed and paid for. Third-party platforms and licences remain subject to their own terms.
We review the new platform, available connections, and required reporting fields. If the addition is covered by the managed-service scope, we update the dashboard. Larger integrations or new reporting sections are scoped and quoted separately.
Tell us which reports your team currently prepares, which systems hold the information, and where the numbers do not match.
We will review the available data, define the reporting requirements, and recommend the dashboard structure. You will receive the diagnostic document whether you continue with the build or use it internally.
Our insights